

 InfoSearched
Every org chart in the building is telling you a story that isn’t quite true.
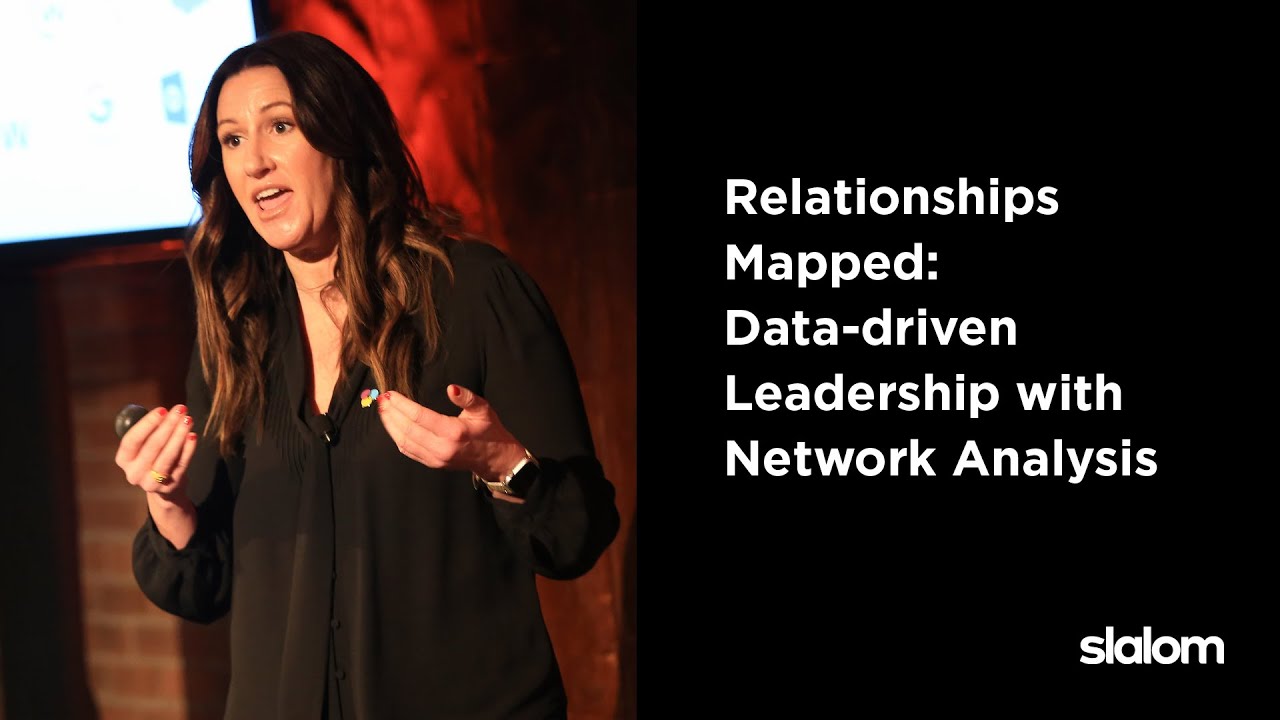
It shows who reports to whom, but it says nothing about who actually answers the 9 p.m. Slack message, who three different departments quietly route around to get things done, or who’s one bad week away from burning out and walking. In “Relationships Mapped: Data-driven Leadership with Network Analysis,” presented by Slalom Chicago, speaker Katya Siddall makes the case for a different map entirely — one built from Organizational Network Analysis (ONA), a method for tracking the informal relationships that run underneath the boxes and dotted lines.
- ONA is grounded in social network theory and works as an enterprise-level method for collecting, analyzing, and visualizing workplace interactions that exist outside the formal org chart.
- Unlike static employee surveys, ONA produces relational maps showing how staff actually communicate, share knowledge, and influence one another day to day.
- Siddall highlights how the data exposes both “pockets of excellence” — informal connectors, brokers, and high-performing hubs — and structural problems like bottlenecks, silos, and isolated employees needing intervention.
The Gap Between the Chart and Reality
The traditional org chart answers one question: who has authority over whom. It doesn’t answer the questions that actually determine whether a company ships on time — who’s the go-to person for a tricky client problem, which two departments never talk to each other even though their work overlaps constantly, or who’s quietly holding a fragile process together with no backup. Siddall’s argument is that employee surveys don’t fill that gap either, since they capture subjective, one-time snapshots rather than the ongoing patterns of how work actually flows.
Building the Relational Map
ONA works by gathering behavioral data on real interactions — communication logs, collaboration patterns, and knowledge-sharing behaviors — and running it through social network analysis techniques to produce a visual map of the organization as it actually functions. That map reveals informal connectors and brokers who move information across teams even though nothing on their job title says so, along with clusters of high performers Siddall describes as pockets of excellence.
The org chart shows who reports to whom. Organizational Network Analysis shows who actually gets the work done.
Visualizing Operational Bottleneck Constraints
The flip side of finding pockets of excellence is finding the drag points, and Siddall walks through what those look like on a network map: cross-functional silos where two teams should be collaborating but aren’t, structural bottlenecks where too much work funnels through too few people, and isolated employees who show up as disconnected nodes with no meaningful ties to the rest of the network. Each of those is a specific, addressable management problem once it’s visible — which is the entire pitch for running the analysis in the first place.
Turnover Risk and Strategic Payoff
One of the sharper points in the talk is about the central nodes — the informal connectors everyone routes through. Those people are usually overworked precisely because they’re indispensable, which makes them a quiet flight risk if leadership never notices the load they’re carrying. Siddall frames ONA as a way to catch that pattern before it turns into a resignation, while also using the same data to speed up cross-team innovation and give enterprise transformation efforts a real map to work from instead of guesswork. That kind of data-driven approach to workforce decisions sits alongside the broader shift companies have been making toward measurable, evidence-based management, the same instinct driving interest in how AI-driven analysis is reshaping decision-making across other parts of the enterprise.
The practical takeaway from Siddall’s talk isn’t abstract — it’s that the employee everyone quietly depends on to keep three teams talking to each other is exactly the person a traditional org chart will never flag as a risk. ONA is built to catch that before the resignation letter does, which is the whole reason Slalom is pitching it to enterprise leadership rather than just HR.




The Five Laws of Cybersecurity | Nick Espinosa | TEDxFondduLac
The Infinadeck Omnidirectional Treadmill
THE FUTURE U.S. ARMY – FUTURISTIC WEAPONS FROM D.A.R.P.A. (National Geographic Documentary
AMAZING TECHNOLOGIES OF THE FUTURE
10 Mastermind Hackers That Outplayed Everyone (even NASA)